Thursday, July 8, 2021

Spring Boot - Multi threading using @Async

In this article, we’ll explore the Multi-threading support provided in Spring or Spring Boot using Spring's @Async annotation.


Why to use
@Async while using Spring Framework? 

It supports Dependency injection and manages the life cycle of threads. 

Internally it uses  ThreadPoolTaskExecutor is a JavaBean that provides an abstraction around a java.util.concurrent.ThreadPoolExecutor instance and exposes it as a Spring org.springframework.core.task.TaskExecutor. Further, it is highly configurable through the properties of corePoolSize, maxPoolSize, queueCapacity, allowCoreThreadTimeOut and keepAliveSeconds. 

How to use @Async ?

We will annotate a bean method;  @Async will make it execute in a separate thread, i.e. the caller will not wait for the completion of the called method.

To enable this support we need to do couple of things as follows :

  • Add the @EnableAsync Annotation to a configuration class
  • customize the ThreadPoolTaskExecutor .


  • Add @Async Annotation to a Method

Exception Handling
As you must have been noticed in above code snippet we already added RejectedExecutionHandler but that is not enough while handling Exceptions in multithreaded environment. 

When a method return type is a Future, exception handling is easy. Future.get() method will throw the exception. But if the return type is void, exceptions will not be propagated to the calling thread. So, we need to add extra configurations to handle exceptions.

We'll create a custom async exception handler by implementing AsyncUncaughtExceptionHandler interface. The handleUncaughtException() method is invoked when there are any uncaught asynchronous exceptions:


Note : CompletableFuture, which was introduced in Java 8, provides an easy way to write asynchronous, non-blocking, and multi-threaded code.
    The Future interface was introduced in Java 5 to handle asynchronous computations. But, this interface did not have any methods to combine multiple asynchronous computations and handle all the possible errors. The  CompletableFuture implements Future interface, it can combine multiple asynchronous computations, handle possible errors and offers much more capabilities.


Conclusion

we have seen ThreadPoolTaskExecutor is a powerful abstraction around a java.util.concurrent.ThreadPoolExecutor and how we can implemented multithreading application using @Async.

Friday, December 27, 2019

A Guide to Production JVM (Java Virtual Machine) Tuning

Careful tuning of the JVM is very important to ensure stable and flawless behavior of the application.
JVM Tuning Procedure
The final goal of tuning is to make an application have a larger throughput at the lowest cost of hardware consumption. JVM tuning is no exception. JVM tuning mainly involves optimizing the garbage collector for better collection performance so that applications running on VMs can have a larger throughput while using less memory and experiencing lower latency. Note that less memory/lower latency does not necessarily mean that the less/lower the memory/latency is, the better the performance is. It is about the optimal choice.

JVM Memory
Probably the most important tuning we can apply to the Java™ Virtual Machine (JVM) is to configure how much heap memory (used for allocations at runtime) to use.Sizing the heap to ensure an adequate amount of memory is available but still manageable to garbage collection is important in optimizing overall performance.
By default, if server has less than 2 gigabytes (GB) of available memory, it should configure the Java heap to be a minimum of 256 megabytes (MB) and a maximum of 1GB.
This means that when server is launched, 256 MB are available for newly created objects. If more than 256 MB are required, the JVM garbage collects and expands the heap (if necessary) until it reaches 1 GB. At this point, the JVM must garbage collect in order to free up released memory to be re-used.
Understanding JVM Memory Model, Java Memory Management are very important if you want to understand the working of Java Garbage Collection.

JDK 8 Memory Model

Metaspace memory allocation model

    • Most allocations for the class metadata are now allocated out of native memory.
    • By default class metadata allocation is limited by the amount of available native memory.


Note: Before Java 8, memory model was different and we are not considering that for this guide.

The Java memory model is specified in JVM specification, Java SE 8 Edition, and mainly in the chapters “2.5 Runtime Data Areas” and “2.6 Frames”.
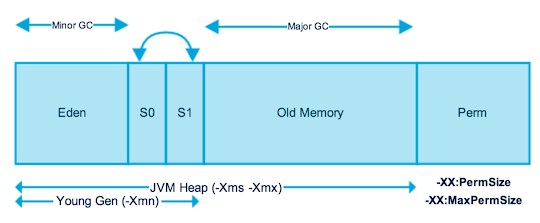
The heap space holds object data, the method area holds class code, and the native area holds references to the code and object data.

Memory part
Description
Young Generation
Young generation is the place where all the new objects are created. When young generation is filled, garbage collection is performed. This garbage collection is called Minor GC. Young Generation is divided into three parts – Eden Memory and two Survivor Memory spaces.
Old Generation
Old Generation memory contains the objects that are long lived and survived after many rounds of Minor GC. Usually garbage collection is performed in Old Generation memory when it’s full. Old Generation Garbage Collection is called Major GC and usually takes longer time.
Permanent Generation
Permanent Generation or “Perm Gen” contains the application metadata required by the JVM to describe the classes and methods used in the application. Note that Perm Gen is not part of Java Heap memory.
Perm Gen is populated by JVM at runtime based on the classes used by the application. Perm Gen also contains Java SE library classes and methods. Perm Gen objects are garbage collected in a full garbage collection.
Method Area
Method Area is part of space in the Perm Gen and used to store class structure (runtime constants and static variables) and code for methods and constructors.
Memory Pool
Memory Pools are created by JVM memory managers to create a pool of immutable objects, if implementation supports it. String Pool is a good example of this kind of memory pool. Memory Pool can belong to Heap or Perm Gen, depending on the JVM memory manager implementation.
Runtime Constant Pool
Runtime constant pool is per-class runtime representation of constant pool in a class. It contains class runtime constants and static methods. Runtime constant pool is the part of method area.
Java Stack Memory
Java Stack memory is used for execution of a thread. They contain method specific values that are short-lived and references to other objects in the heap that are getting referred from the method.

JVM memory switches

Java provides a lot of memory switches that we can use to set the memory sizes and their ratios. Some of the commonly used memory switches are


VM switch
Description
-server
Make Server a Server. Turns Java VM features specific to server applications, such as sophisticated JIT compiler. Though this option is implicitly enabled for x64 virtual machines, it still makes sense to use it as according to documentation behavior maybe changed in the future.
-Xms<heap size>[g|m|k] -Xmx<heap size>[g|m|k]
Minimal and Maximal heap size. (For production, it is recommended to keep both values same i.e. max=min, not vice-versa )

-XX:MaxMetaspaceSize=<metaspace size>[g|m|k]
To overcome any unnecessary instability. To avoid dynamic heap resizing and lags, which could be caused by this, we explicitly specify minimal and maximal heap size. Thus Java VM will spend time only once to commit on all the heap. By default Metaspace in Java VM 8 is not limited, though for the sake of system stability it makes sense to limit it with some finite value.
-Xmn<young size>[g|m|k]
-XX:MaxNewSize<young size>[g|m|k]
Explicitly define size of the young generation. The second most influential factor is the proportion of the heap reserved for the Young Generation. (divides up the heap memory into three generations: Young Generation,Old Generation (also called Tenured) and Permanent Generation,)
-XX:SurvivorRatio=<ratio>
Ratio which determines size of the survivor space relatively to eden size. Ratio can be calculated using following formula: $$survivor ratio = (\frac{young size}{survivor size}) - 2$$
-XX:+UseG1GC
-XX:MaxGCPauseMillis=200
-XX:ParallelGCThreads=20
-XX:ConcGCThreads=5
-XX:InitiatingHeapOccupancyPercent=70
User of Garbage collector (This G1 GC is introduced in Java 7 update 4 and it is replacing CMS collector since it's more performance efficient.)
Sets a target for the maximum GC pause time. This is a soft goal, and the JVM will make its best effort to achieve it.
Sets the number of threads used during parallel phases of the garbage collectors. The default value varies with the platform on which the JVM is running.
Number of threads concurrent garbage collectors will use. The default value varies with the platform on which the JVM is running.
Percentage of the (entire) heap occupancy to start a concurrent GC cycle. GCs that trigger a concurrent GC cycle based on the occupancy of the entire heap and not just one of the generations, including G1, use this option. A value of 0 denotes 'do constant GC cycles'. The default value is 45.
-XX:+UseStringDeduplication
Java 8u20 has introduced one more JVM parameter for reducing the unnecessary use of memory by creating too many instances of same String. This optimizes the heap memory by removing duplicate String values to a global single char[] array.

Misc parameters (Use only if required)
  • -XX:+UseLWPSynchronization: sets LWP (Light Weight Process) – based synchronization policy instead of thread-based synchronization
  • -XX:LargePageSizeInBytes: sets the large page size used for the Java heap; it takes the argument in GB/MB/KB; with larger page sizes we can make better use of virtual memory hardware resources; however, this may cause larger space sizes for the PermGen, which in turn can force to reduce the size of Java heap space
  • -XX:MaxHeapFreeRatio: sets the maximum percentage of heap free after GC to avoid shrinking.
  • -XX:MinHeapFreeRatio: sets the minimum percentage of heap free after GC to avoid expansion; to monitor the heap usage you can use VisualVM shipped with JDK.
  • -XX:SurvivorRatio: Ratio of eden/survivor space size – for example, -XX:SurvivorRatio=6 sets the ratio between each survivor space and eden space to be 1:6,
  • -XX:+UseLargePages: use large page memory if it is supported by the system; please note that OpenJDK 7 tends to crash if using this JVM parameter
  • -XX:+UseStringCache: enables caching of commonly allocated strings available in the String pool
  • -XX:+UseCompressedStrings: use a byte[] type for String objects which can be represented in pure ASCII format
  • -XX:+OptimizeStringConcat: it optimizes String concatenation operations where possible

JVM memory switches for OutOfMemoryError

Java 8 gives error before JVM crash so that we can analyze the logs.
Note : A memory dump can cause considerable pauses on big heaps during OOM event. However, if Java VM is at OOM already, collecting as much information about the issue is more important than trying to serve traffic with completely broken application


VM switch
Description
-XX:+HeapDumpOnOutOfMemoryError
-XX:HeapDumpPath=<path to dump>`date`.hprof
If server application would ever fail with out-of-memory in production, you would not want to wait for another chance to reproduce the problem. These options instruct Java VM to dump memory into file, when OOM occurred.
-XX:OnOutOfMemoryError="< cmd args >;< cmd args >"
-XX:OnOutOfMemoryError="shutdown -r" . If we want to restart the server as soon as out of memory occur, we can set the parameter.

For monitoring purpose only we should use below parameters :
  1. -XX:+UseGCLogFileRotation
  2. -XX:NumberOfGCLogFiles=< number of log files > 
  3. -XX:GCLogFileSize=< file size >[ unit ]
  4. -Xloggc:/path/to/gc.log
Also we should use to visualize the memory utilization :
  1. Jconsole (JDK_HOME/bin/jconsole.exe <PROCESS ID OF YOUR JAVA APPLICATION>)
  2. VisualVM (JDK_HOME/bin/jvisualvm.exe)